Information: HydroCrowd

This depends on the type of station you want to report from: a weather station, a water station, the Weather@Home or the Photo Note. Look at the instructions for every station type below:1.) Are you at a weather station?Take a photo of the info board. Make sure that it is possible to read the values on the thermometer, hygrometer and the rain gauge from the photo (see example below).2.) Are you at a water station?Take a photo of the water level gauge in the water (see example below) and...
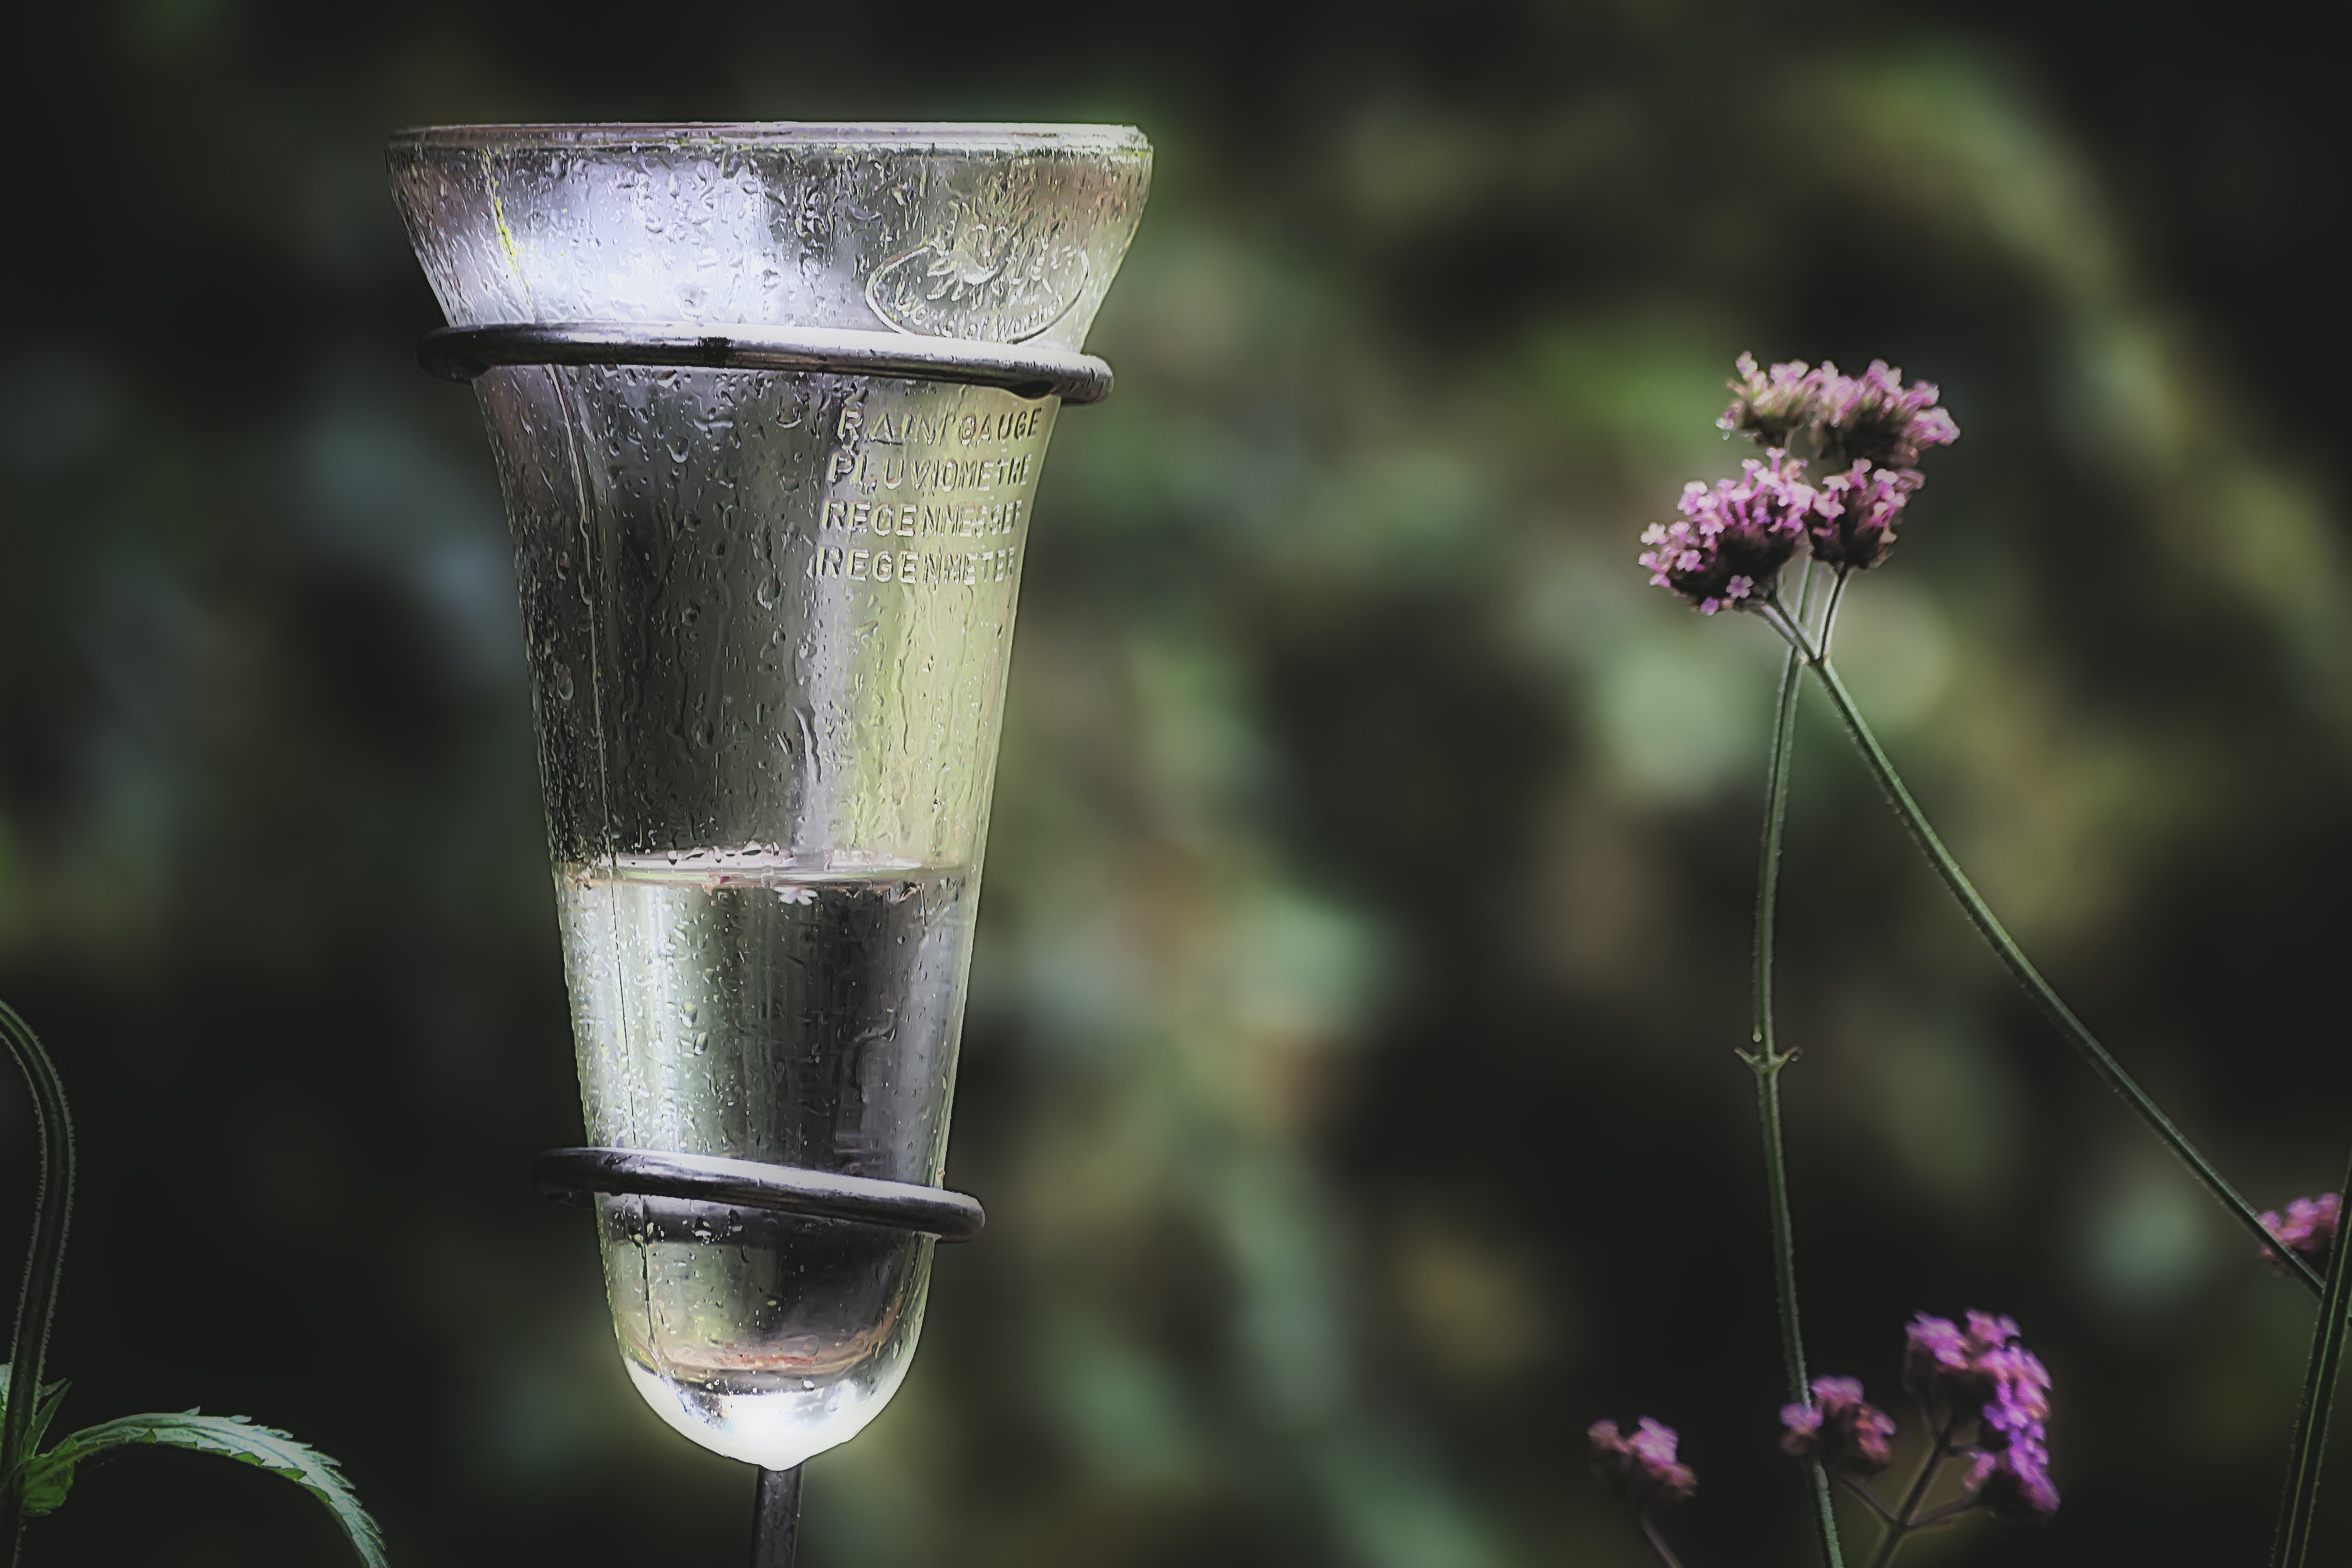
Rainfall at a certain location is measured with a rain gauge. At the station, the rain gauge is mounted on the right side of the info board (see example below). Rainfall is measured in millimeters (mm). The scale on the side of the rain gauge indicates how much rain fell since the last time the rain gauge was emptied. The scale is divided into intervals of 1 mm (short marks) and 5 mm (long marks). Look at the water in the rain gauge. Position yourself, such that your eyes are at the...

The thermometer measures the air temperature at a certain location. The thermometer at this station measures temperatures from -35 to 55 degrees Celsius (°C) (see example below).When the temperature is negative (below 0°) it is freezing. The scale on the thermometer is divided into intervals of 1°C (short marks) and 5°C (long marks). The mark closest to the pointer is the current temperature. In the example above the temperature is 20°C.

The hygrometer (see example below) measures how moist the air is at a certain location. This is also called relative humidity. It can measure the humudity from 0 % (completly dry) to 100% (very humid). The scale on the hygrometer is divided into intervals of 1% (short marks) and 5% (long marks). The mark closest to the pointer is the current humidity. In the example above the humidity is 50%.

A water level gauge can be used to measure the water level in a river. By taking regular measurements, you can record the changes in water level over time. The scale on the water level gauge is in centimeters (cm). This is one type of water level gauge, where each mark is 1 centimeter wide: In this example, the water level is 56 cm (4 cm below 60). This is the value you enter as 'Water level value' in the app.In the case that the water level of a river can rise above 1 meter (100...

Turbidity can be measured with a turbidity tube (see image below). The tube has a scale on the side. Higher values indicate that more particles are dissolved in the water and that it its less clear. In terms of water quality, the lower the value the better.To measure the turbidity several steps are necessary:First fill the bucket attached to the chain with water from the river. Try to collect water from the surface of the river and not from the river bed.Then pour a little bit...

Un indicador de nivel de agua (regleta) puede utilizarse para medir el nivel del agua en un río o quebrada.Realizando mediciones periódicas, se pueden registrar los cambios del nivel del agua a lo largo del tiempo. La escala del indicador del nivel del agua está en centímetros (cm). Este es un tipo de indicador del nivel del agua, en el que cada marca tiene 1 centímetro de ancho: En este ejemplo, el nivel de agua es de 56 cm (4 cm debajo de 60). Este es el valor que debes ingresar...

La turbiedad puede medirse con un tubo de turbidez (ver la siguiente imagen).El tubo tiene una escala en un lado. Los valores más altos indican que hay más partículas disueltas en el agua y que es menos clara. En términos de calidad del agua, cuanto menor sea el valor, mejor.Para medir la turbiedad son necesarios varios pasos:En primer lugar, se debe llenar con agua del río la jarra o el cubo fijado a la estación con. Intente recoger agua de la superficie del río y no del fondo.A...

You can choose between four different station types:- Weather station: At this station, you can measure of different weather variables like rainfall, air temperature, humidity, and wind. This can only be done at existing HydroCrowd stations.- Water station: At this station, you can measure the water level and turbidity of the river water. This can only be done at existing HydroCrowd stations.- Weather@Home: Create your own spot and provide weather information from your rain gauge at...

Puede elegir entre cuatro tipos de estación diferentes:Estación meteorológica: En esta estación se pueden medir diferentes variables meteorológicas como precipitación, temperatura del aire y humedad. Esto sólo se puede hacer en las estaciones ya existentes de HydroCrowd.Estación hidrológica: En esta estación se puede medir el nivel del agua y la turbiedad del agua del río. Esto sólo se puede hacer en las estaciones ya existentes de HydroCrowd.Tiempo en Casa: Cree su propio punto y...

Esto depende del tipo de estación de la cual desea informar: Estación Meteorológica, Estación Hidrológica, Tiempo en Casa o Foto Nota. Mire a continuación las instrucciones para cada tipo de estación:1.) ¿Está en una estación meteorológica?Saque una foto del panel informativo. Asegúrese de que es posible leer los valores del termómetro, higrómetro y pluviómetro en la foto (ver ejemplo más abajo)2.) ¿Se encuentra en una estación hidrológica?Saque una foto del indicador del nivel de agua...

¿Cómo medir la cantidad de lluvia?La lluvia que cae en un lugar determinado se mide con un pluviómetro. En la estación, el pluviómetro está montado a la derecha del panel informativo ( ver ejemplo más abajo).La lluvia o precipitación se mide en milímetros (mm). La escala situada en un lado del pluviómetro indica la cantidad de lluvia caída desde la última vez que se vació el pluviómetro. La escala está dividida en intervalos de 1 mm (marcas cortas) y 5 mm (marcas largas). Mire el agua...

El termómetro mide la temperatura del aire en un lugar determinado. El termómetro de esta estación mide la temperatura entre -35 y 55 grados Celsius (°C) ( ver ejemplo a continuación). Cuando la temperatura es negativa (por debajo de 0°) está helando. La escala del termómetro está dividida en intervalos de 1°C (marcas cortas) y 5°C (marcas largas). La marca más cercana a la aguja es la temperatura actual. En el ejemplo anterior, la temperatura es de 20 °C.

El higrómetro ( ver ejemplo más abajo) mide el grado de humedad del aire en un lugar determinado. También se denomina humedad relativa.Puede medir la humedad desde el 0% (completamente seco) hasta el 100% (muy húmedo). La escala del higrómetro está dividida en intervalos del 1% (marcas cortas) y del 5% (marcas largas). La marca más cercana a la aguja es la humedad actual. En el ejemplo anterior, la humedad es de 50%.
Unaweza kuchagua kati ya aina nne tofauti za vituo:- Kituo cha hali ya hewa: Katika kituo hiki, unaweza kupima vipengele tofauti vya hali ya hewa kama vile mvua, halijoto na unyevunyevu. Hii inaweza tu kufanywa katika vituo vilivyopo vya HydroCrowd.- Kituo cha maji: Katika kituo hiki, unaweza kupima kiwango cha maji na topetope kwenye maji ya mto. Hii inaweza tu kufanywa katika vituo vilivyopo vya HydroCrowd.- Hali ya hewa @ Nyumbani: Unda kituo chako mwenyewe na utoe maelezo ya hali ya...
Topetope linaweza kupimwa kwa kutumia bomba la topetope (tazama picha hapa chini). Bomba lina alama katika upande. Kiwango kikubwa kinaonyesha kuwa chembe nyingi zaidi huyeyushwa ndani ya maji na kwamba maji siyo meupe sana. Kwa upande wa ubora wa maji, kiwango cha chini ni bora zaidi.Ili kupima topetope, hatua kadhaa zinahitajika:Kwanza jaza maji kwenye jagi lililoshikiliwa na mnyororo kutoka mtoni. Jaribu kuchukua majiya juu ya uso wa mto na si kutoka kchin ya mto.Kisha...
Kipimo cha kiwango cha maji kinaweza kutumika kupima kiasi cha maji katika mto. Kwa kuchukua vipimo vya kila mara, unaweza kurekodi mabadiliko katika kiwango cha maji kwa muda. Alama kwenye kipimo cha kiwango cha maji ni sentimita (cm). Hii ni aina moja ya kipima kiwango cha maji, ambapo kila alama ina upana wa sentimita 1: Katika mfano huu, kiwango cha maji ni 56 cm (4 cm chini ya 60). Hiki ndicho kiasi unaweza kuweka kama 'Kiasi cha kiwango cha maji' kwenye programu.Ikiwa...
Kipimo cha kupima unyevunyevu (tazama mfano hapa chini) hupima jinsi hewa ilivyo na unyevunyevu katika eneo fulani. Hii pia inaitwa unyevu wa kwa kulinganishwa. Inaweza kupima unyevunyevu kwenye hewa kutoka 0% (kavu kabisa) hadi 100% (yenye unyevu sana). alama kwenye kipima unyevunyevu zimegawanywa katika vipindi vya 1% (alama fupi) na 5% (alama ndefu). Alama iliyo karibu na mshale ni unyevunyevu wa sasa. Katika mfano hapo juu unyevu ni 50%.
Kipimajoto hupima joto la hewa mahali fulani. Kipimajoto katika kituo hiki hupima joto kutoka -35 hadi 55 digrii Selsiasi (°C) (tazama mfano hapa chini).Wakati hali ya joto ni hasi (chini ya 0 °) ni kufungia. Kiwango kwenye thermometer imegawanywa katika vipindi vya 1 ° C (alama fupi) na 5 ° C (alama ndefu). Alama iliyo karibu na pointer ni halijoto ya sasa. Katika mfano juu ya joto ni 20 ° C.

Mvua katika eneo fulani hupimwa kwa kipima mvua. Kwenye kituo, kipimo cha mvua kimewekwa upande wa kulia wa ubao wa taarifa (angalia mfano hapa chini). Mvua hupimwa kwa milimita (mm). Alama zilizo kando ya kipimo cha mvua zinaonyesha ni kiasi gani cha mvua ilinyesha tangu mara ya mwisho kipima mvua kilipomwagwa. Kiwango kinagawanywa katika vipindi vya 1 mm (alama fupi) na 5 mm (alama ndefu). Kuangalia kiasi cha maji katika kipimo cha mvua. Simama mwenyewe, ili macho yako yawe kwenye...
Hii inategemea aina ya kituo unachotaka kuripoti: kituo cha hali ya hewa, kituo cha maji, Hali ya Hewa@Nyumbani au Dokezo Picha.Tazama maagizo ya kila aina ya kituo hapa chini:1.) Je, uko kwenye kituo cha hali ya hewa?Je, uko kwenye kituo cha hali ya hewa? Piga picha ya ubao wa taarifa. Hakikisha kwamba inawezekana kusoma namba kwenye kipima joto, kipima unyevunyevu na kipima mvua kutoka kwenye picha (angalia mfano hapa chini).2.) Je, uko kwenye kituo cha maji?Piga picha ya...